Proteome-pI - Proteome Isoelectric Point Database is a database of pre-computed isoelectric points for proteomes from different model organisms (5029 species).
Full list of organisms can be seen here
General statistics for analyzed proteomes
|
|
Number of proteomes |
Total number of proteins |
Mean number of proteins ± SD |
Mean size of proteins ± SD |
Mean mw of proteins ± SD |
|
Viruses Archaea Bacteria Eukaryote (all isoforms) Eukaryote (main isoform) Eukaryote (minor isoforms) |
504 135 3,776 614 614 448 |
20,920 318,388 12,082,903 9,299,039 8,629,591 669,448 |
42 ± 89 2,358 ± 920 3,200 ± 2,510 15,145 ± 11,830 14,055 ± 9,899 1,494 ± 5,130 |
297 ± 375 283 ± 212 311 ± 240 438 ± 429 434 ± 416 495 ± 564 |
33 ± 42 31 ± 23 34 ± 26 49 ± 48 48 ± 46 55 ± 63 |
|
|
IDM number of proteins |
Median number of protein |
IDM size of proteins |
Median size of protein |
IDM mw of proteins |
Median mw of protein |
|
Viruses Archaea Bacteria Eukaryote (all isoforms) Eukaryote (main isoform) Eukaryote (minor isoforms) |
22 2,254 3,011 13,187 12,618 387 |
7 2,065 2,950 11,684 11,585 15 |
225 255 279 369 367 407 |
182 241 265 336 334 362 |
26 28 31 41 41 45 |
21 27 29 37 37 40 |
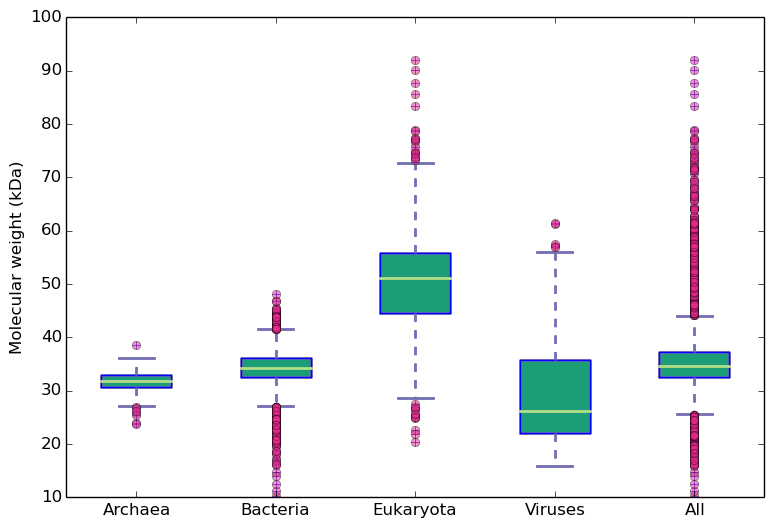
As one can see Viruses have the smallest proteomes (coding usually only handful number of proteins) with compacted proteins. Than Archaea step in with relatively small proteomes (~2.2k) and short proteins (241-283 aa). The next group, Bacteria, code ~10% bigger proteomes (~3k) and proteins (265-311 aa).
Eukaryote on the other hand are the most sophisticated, having the biggest proteomes (~14k) and long proteins (367-495 aa). Moreover, many of them posses multiple splicing isoforms which in some cases can significantly increase proteome complexity (e.g. in humans 21,006 proteins vs. 71,173 additional isoforms)
General isoelectric point statistics
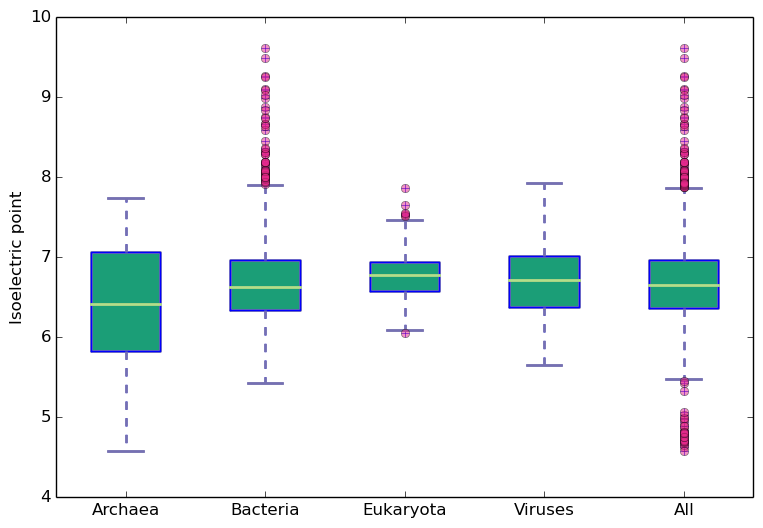
It is well known that isoelectric point distribution across proteomes is well conserved and it has bimodal shape. This can be easily seen on plots below: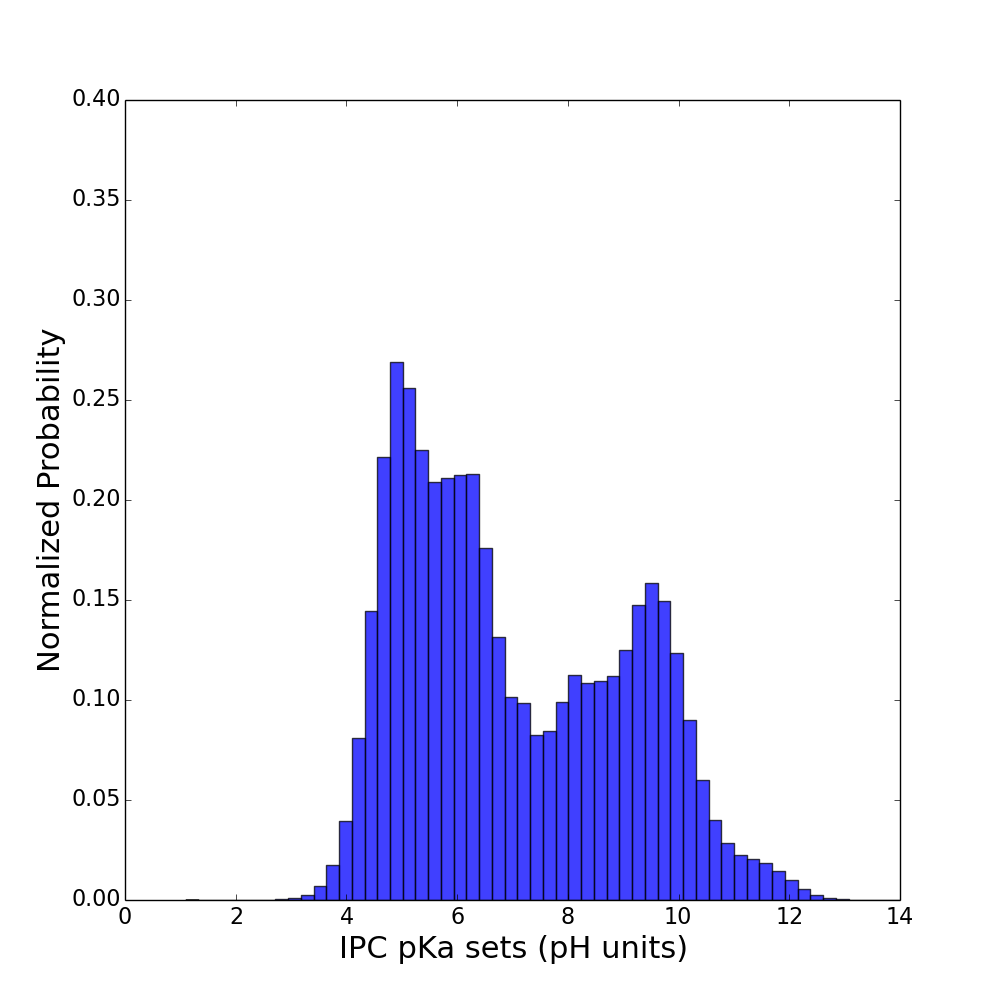
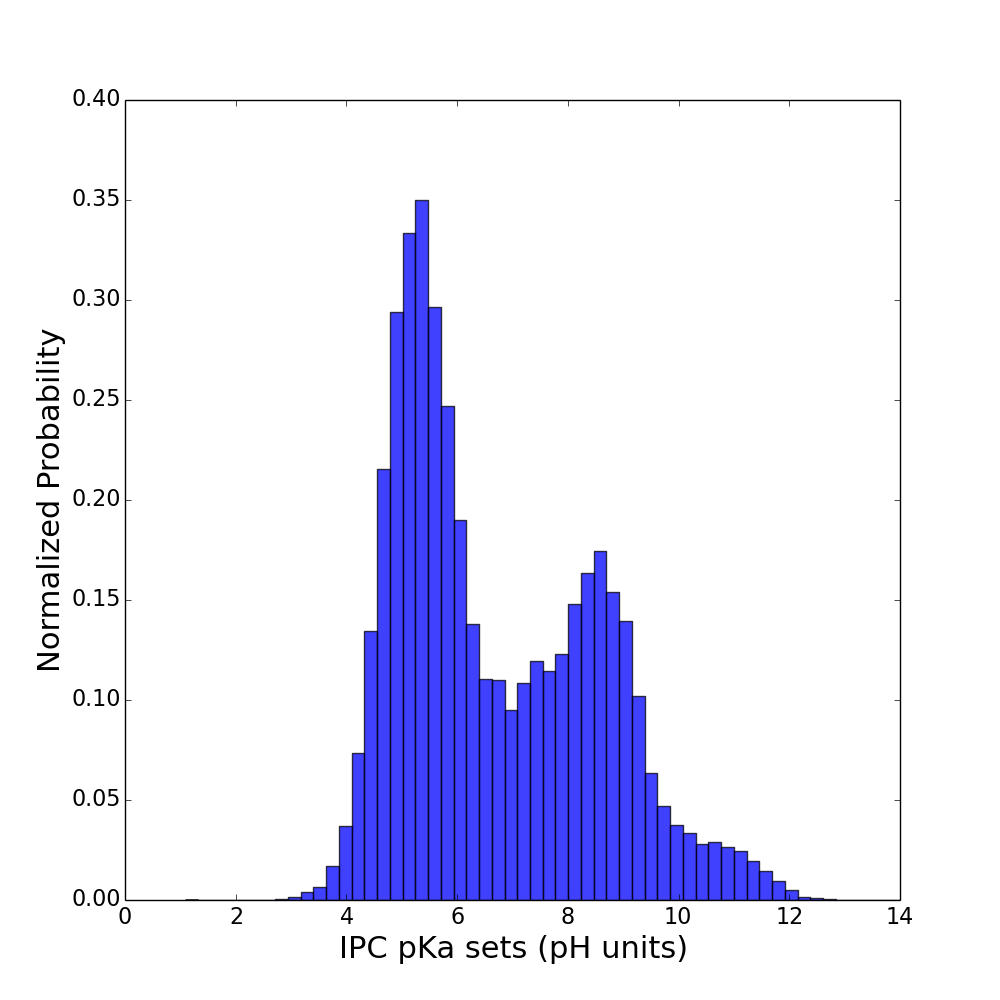
nr (86 millions of proteins) Uniprot (63 millions of proteins)
Molecular weight and isoelectric points across kingdoms
Amino acid frequency across kingdoms
| Kingdom | Ala | Cys | Asp | Glu | Phe | Gly | His | Ile | Lys | Leu | Met | Asn | Pro | Gln | Arg | Ser | Thr | Val | Trp | Tyr | Total |
Dipeptide frequency |
|---|---|---|---|---|---|---|---|---|---|---|---|---|---|---|---|---|---|---|---|---|---|---|
| Viruses | 6.61 | 1.76 | 5.81 | 6.04 | 4.25 | 5.79 | 2.15 | 6.53 | 6.35 | 8.84 | 2.46 | 5.41 | 4.62 | 3.39 | 5.24 | 7.06 | 6.06 | 6.50 | 1.19 | 3.94 | 6,150,189 |
|
| Archaea | 8.20 | 0.98 | 6.21 | 7.69 | 3.86 | 7.58 | 1.77 | 7.03 | 5.27 | 9.31 | 2.35 | 3.68 | 4.26 | 2.38 | 5.51 | 6.17 | 5.44 | 7.80 | 1.03 | 3.45 | 89,488,664 |
|
| Bacteria | 10.06 | 0.94 | 5.59 | 6.15 | 3.89 | 7.76 | 2.06 | 5.89 | 4.68 | 10.09 | 2.38 | 3.58 | 4.61 | 3.58 | 5.88 | 5.85 | 5.52 | 7.27 | 1.27 | 2.94 | 3,716,982,916 |
|
| Eukaryota | 7.63 | 1.76 | 5.40 | 6.42 | 3.87 | 6.33 | 2.44 | 5.10 | 5.64 | 9.29 | 2.25 | 4.28 | 5.41 | 4.21 | 5.71 | 8.34 | 5.56 | 6.20 | 1.24 | 2.87 | 3,743,221,293 |
|
| All | 8.76 | 1.38 | 5.49 | 6.32 | 3.87 | 7.03 | 2.26 | 5.49 | 5.19 | 9.68 | 2.32 | 3.93 | 5.02 | 3.90 | 5.78 | 7.14 | 5.53 | 6.73 | 1.25 | 2.91 | 7,555,843,062 |
|


Proteome-pI is available under Creative Commons Attribution-NoDerivs license, for more details see here
| Reference: Kozlowski LP. Proteome-pI: proteome isoelectric point database. Nucleic Acids Res. 2016. doi: 10.1093/nar/gkw978 |
Contact: Lukasz P. Kozlowski |