Actinoplanes missouriensis (strain ATCC 14538 / DSM 43046 / CBS 188.64 / JCM 3121 / NCIMB 12654 / NBRC 102363 / 431)
Taxonomy: cellular organisms; Bacteria; Terrabacteria group; Actinobacteria; Actinobacteria; Micromonosporales; Micromonosporaceae; Actinoplanes; Actinoplanes missouriensis
Average proteome isoelectric point is 6.6
Get precalculated fractions of proteins

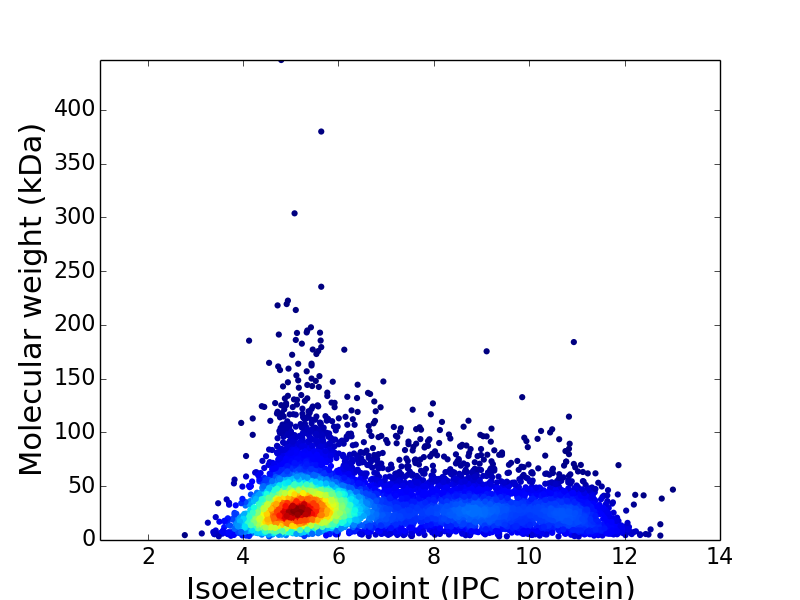
Virtual 2D-PAGE plot for 8,113 proteins (isoelectric point calculated using IPC_method)
Get csv file with sequences according given criteria:
* You can choose from 18 different methods for calculating isoelectric point
Protein with the lowest isoelectric point:
>tr|I0H4K7|I0H4K7_ACTM4 Uncharacterized protein
MDDTQTPQPAPDTSVETTPVDSLVETDELIEEVSIDGMCGVY
MDDTQTPQPAPDTSVETTPVDSLVETDELIEEVSIDGMCGVY
Molecular weight: 4.53 kDa
Isoelectric point according different methods:
Isoelectric point according different methods:
Protein with the highest isoelectric point:
>tr|I0HE89|I0HE89_ACTM4 Uncharacterized protein
MVATAIAVVTRVAATGAGSVAVTVTVVVTRVAATGAVSVVGTVRRATVVVSVVTVRRVTVRRVAASVVATVIVAATRVAATAVVSVVATVIVAVTRVAATAVVSVVATVTGAAIRVAATGVVSVVTVRRGAASVVATVTVAVTRVAATAVVSVVATVTVVVSRVAATAVVSVVGTVRRATAVVSVVTVRR
VTVRRVAASVAETVTVAVTRVAATAVVSVVGTVRRATAVVSVVTVRRVTVRRVAASVAETAIAVATRVAATAAVSAVTGRRVTGAATRVAATAAGSVAGTVTVAVTRVAATAAASVAGTVRVVRVRASRATAAGSVVATVRRVTVRRAAASVAETATAVATRVAATAAASVVTVRRVTVRRVAASVVATA
TAVATRVAATGAGSVVATVTGAATRVAATAGATRVATVVVTRVAATGAGSATTTAVATGGTSGTAPVRVRRTRPARRRSSPRTFPRTSSRPTSTRRSARN
Molecular weight: 46.86 kDa
Isoelectric point according different methods:
Isoelectric point according different methods:
General Statistics
Number of major isoforms |
Number of additional isoforms |
Number of all proteins |
Number of amino acids |
Min. Seq. Length |
Max. Seq. Length |
Avg. Seq. Length |
Avg. Mol. Weight |
|---|---|---|---|---|---|---|---|
2,617,316 |
30 |
4,154 |
325.2 |
34.7 kDa |
Amino acid frequency
Ala |
Cys |
Asp |
Glu |
Phe |
Gly |
His |
Ile |
Lys |
Leu |
Met |
Asn |
Gln |
Pro |
Arg |
Ser |
Thr |
Val |
Trp |
Tyr |
|---|---|---|---|---|---|---|---|---|---|---|---|---|---|---|---|---|---|---|---|
13.94 |
0.69 |
5.96 |
5.22 |
2.79 |
9.26 |
2.08 |
3.74 |
1.95 |
10.31 |
1.77 |
1.93 |
2.77 |
6.02 |
7.89 |
5.16 |
6.24 |
8.65 |
1.58 |
2.05 |
For dipeptide frequency statistics click here
Proteome-pI is available under Creative Commons Attribution-NoDerivs license, for more details see here
| Reference: Kozlowski LP. Proteome-pI: proteome isoelectric point database. Nucleic Acids Res. 2016. doi: 10.1093/nar/gkw978 |
Contact: Lukasz P. Kozlowski |

