Spring viraemia of carp virus (strain ATCC VR-1390)
Taxonomy:
Average proteome isoelectric point is 6.02
Get precalculated fractions of proteins

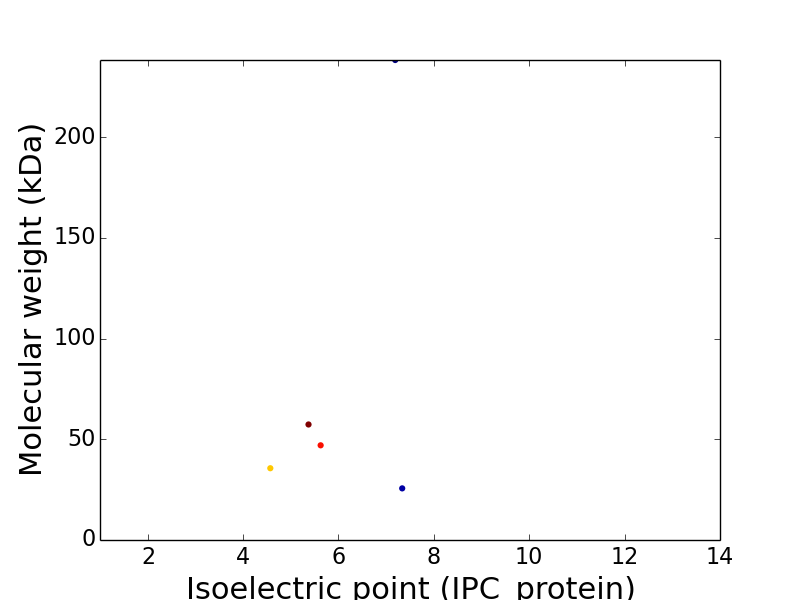
Virtual 2D-PAGE plot for 5 proteins (isoelectric point calculated using IPC_method)
Get csv file with sequences according given criteria:
* You can choose from 18 different methods for calculating isoelectric point
Protein with the lowest isoelectric point:
>tr|Q91DS5|Q91DS5_SVCVA Phosphoprotein
MSLHSKLSESLKAYADLDKTVKEIEEQVSSMEEPVPKTVKYVTFEEDLSEEEWESDSGDDDEDSIDDSLIPDYLRESSSITVDEDEEDQKEDREEHLPTVSWEEEPTGIDIGFGPGIVMPSVSNHEGGTYVRYNGLGGIDPNCKDLISKMMRSLIGQIGNKYGYDIDLFDYQGDFLEVFLPHKPSKEDVR
PDIRIGKKNEEGTSKQVSKPREKEKIVLKTGDECGRFPMNKEAKKREPEGLWEVMKVLSVQFDPWKEDEPPLSLTIRDLFISESEFRLHCNHSQTEREMALVGIKLRRLYNKLYQKYRL
Molecular weight: 35.62 kDa
Isoelectric point according different methods:
Isoelectric point according different methods:
Protein with the highest isoelectric point:
>tr|Q76UB6|Q76UB6_SVCVA Matrix protein
MSTLRKLFGTKKSKGTPPTYEETLATAPVLMDTHDTHSHSLQWMRYHVELDVKLDTPLKTMSDLLGLLKNWDVDYKGSRNKRRFYRLIMFRCALELKHVSGTYSVDGSALYSNKVQGSCYVPHRFGQMPPFKREIEVFRYPVHQHGYNGMVDLRMSICDLNGEKIGLNLLKECQVAHPNHFQKYLEEVGL
EAACSATGEWILDWTFPMPVDVVPRVPSLFMGD
MSTLRKLFGTKKSKGTPPTYEETLATAPVLMDTHDTHSHSLQWMRYHVELDVKLDTPLKTMSDLLGLLKNWDVDYKGSRNKRRFYRLIMFRCALELKHVSGTYSVDGSALYSNKVQGSCYVPHRFGQMPPFKREIEVFRYPVHQHGYNGMVDLRMSICDLNGEKIGLNLLKECQVAHPNHFQKYLEEVGL
EAACSATGEWILDWTFPMPVDVVPRVPSLFMGD
Molecular weight: 25.63 kDa
Isoelectric point according different methods:
Isoelectric point according different methods:
General Statistics
Number of major isoforms |
Number of additional isoforms |
Number of all proteins |
Number of amino acids |
Min. Seq. Length |
Max. Seq. Length |
Avg. Seq. Length |
Avg. Mol. Weight |
|---|---|---|---|---|---|---|---|
0 |
3,554 |
223 |
2,095 |
710.8 |
80.8 kDa |
Amino acid frequency
Ala |
Cys |
Asp |
Glu |
Phe |
Gly |
His |
Ile |
Lys |
Leu |
Met |
Asn |
Gln |
Pro |
Arg |
Ser |
Thr |
Val |
Trp |
Tyr |
|---|---|---|---|---|---|---|---|---|---|---|---|---|---|---|---|---|---|---|---|
4.25 |
1.83 |
5.68 |
7.01 |
3.55 |
6.72 |
2.84 |
6.7 |
6.33 |
9.4 |
2.81 |
4.16 |
3.24 |
4.5 |
5.35 |
8.36 |
5.74 |
5.99 |
2.0 |
3.55 |
For dipeptide frequency statistics click here
See this proteome in:

Proteome-pI is available under Creative Commons Attribution-NoDerivs license, for more details see here
| Reference: Kozlowski LP. Proteome-pI: proteome isoelectric point database. Nucleic Acids Res. 2016. doi: 10.1093/nar/gkw978 |
Contact: Lukasz P. Kozlowski |